Alessandro Frank
CTO

A deep look into how Iridium Works builds a multi layer monitoring system that ensures reliability through open source tools custom automation and proactive alerts.
Monitoring is not an accessory in modern software development. It is an essential safety layer that ensures stability performance and trust. At Iridium Works we built a monitoring stack that combines open source flexibility with custom automation so we always know how our systems behave long before users feel an issue.
Uptime Kuma is an open source monitoring tool that allows us to track service availability with full control. Unlike closed platforms we can extend adapt and integrate it deeply into our workflow.
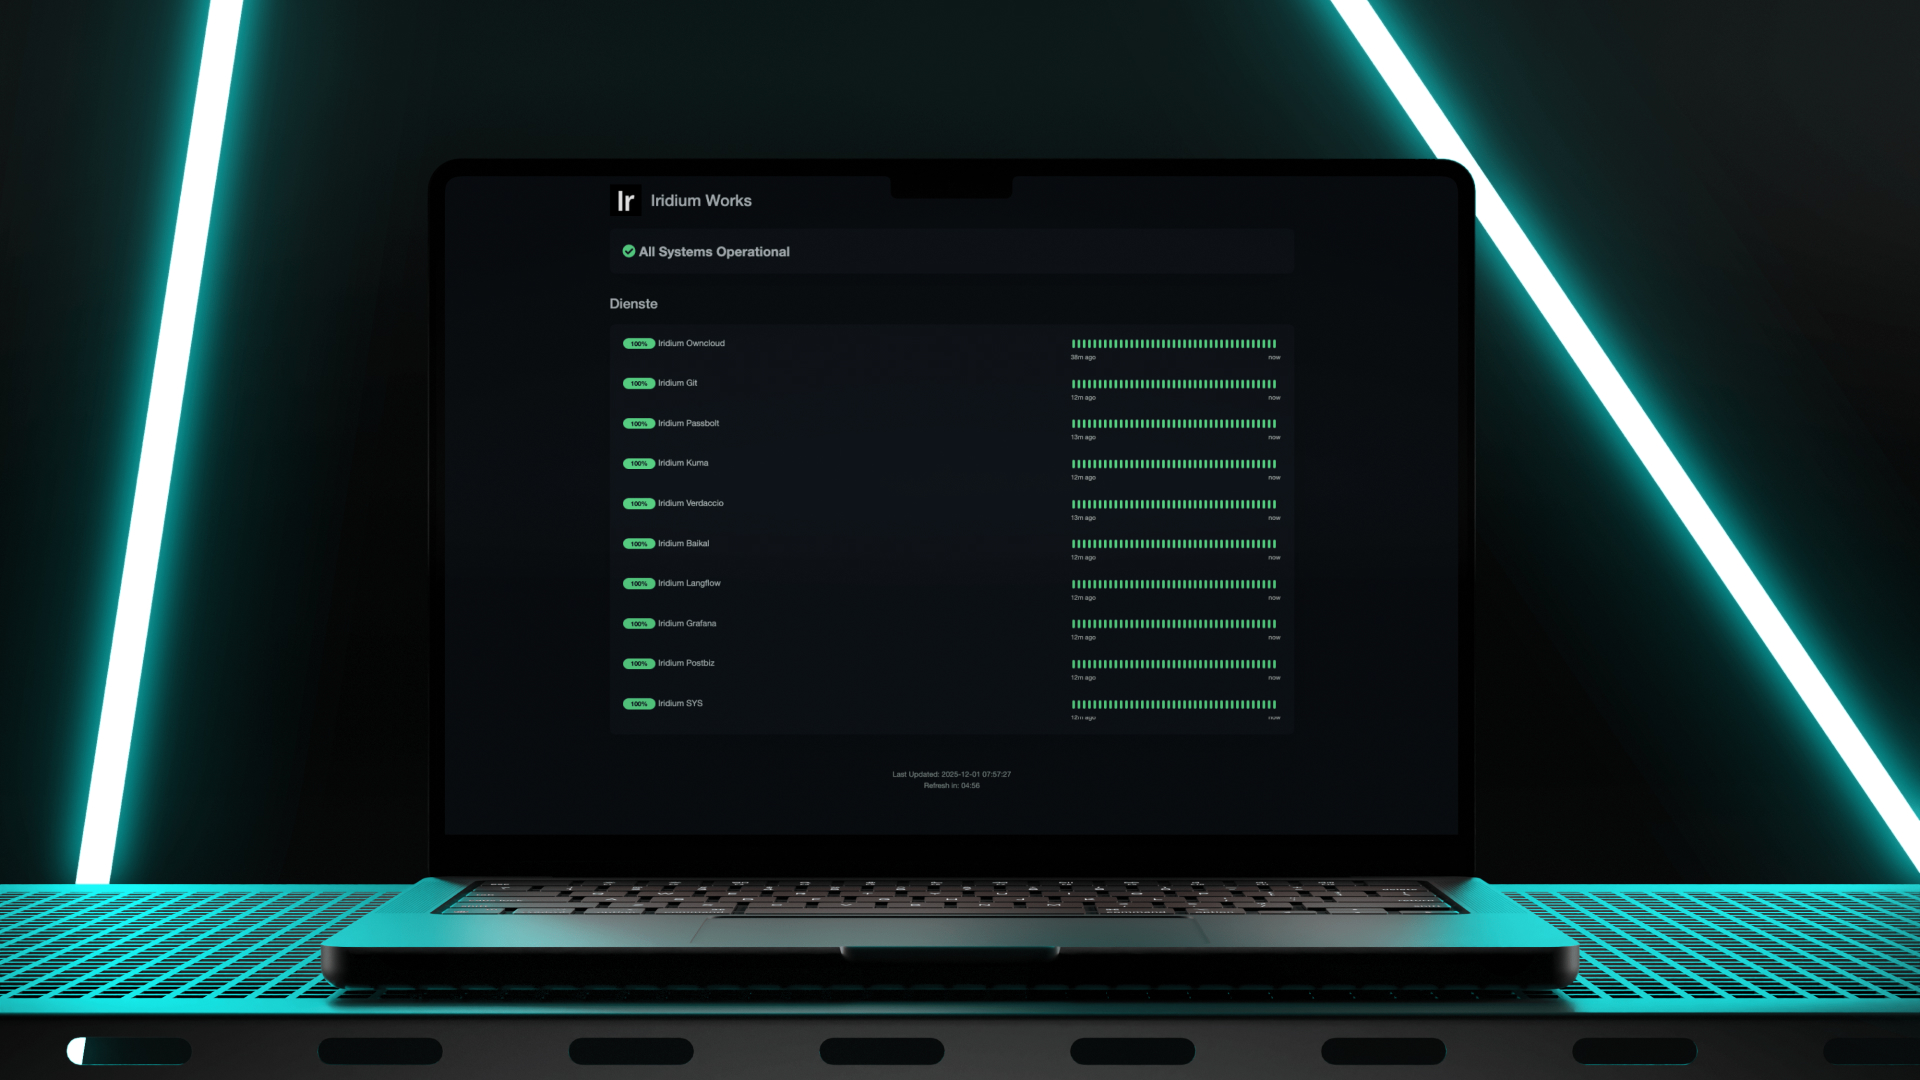
Below is a simplified overview of what we monitor:
Certain business critical processes can only be validated through the exact data an API returns. For this reason we use custom payload checks. Each check ensures that the service not only responds but behaves correctly.
Here is an example of how such a check can look in principle:
// Pseudocode example for a custom API validation
const response = await fetch("https://api.example.com/status", { method: "POST", body: JSON.stringify({ token: "12345" }) })

if (response.status !== 200) alert("Service unreachable")
if (response.data.health !== "ok") alert("Unexpected API state")HTTP status codes are one of the most fundamental signals for identifying issues in digital systems. Each request between a client and a server produces a numeric code that reflects the outcome of the operation. Codes in the 200 range indicate that everything works as expected. Codes in the 300 range show redirections that may or may not be intentional. Errors become visible starting in the 400 range when requests cannot be fulfilled usually due to client side issues. Codes in the 500 range point to server side failures that require immediate attention. By continuously monitoring these status codes we gain early insight into performance degradation recurring error patterns or sudden outages. This layer forms the fastest and most direct indicator of system health.
We designed a Slack integration that connects directly to a webhook. It triggers the moment monitoring thresholds are reached for example if a service fails two retry attempts. This gives our team real time awareness.
Monitoring is one of the most powerful tools to ensure reliability. The stronger the monitoring layer the more confidence your users have in the product you deliver.
Alessandro is a technical mastermind and Chief Technology Officer at Iridium Works. Over the years he has build countless systems working with Front- and BackEnd, DevOps and as a Tech Lead. He writes about new technology, software development.
Access our exclusive whitepapers, expert webinars, and in-depth articles on the latest breakthroughs and strategic implications of webdesign, software development and AI.